


Analyzing Football Player Stats: Goals, Assists, and Advanced Metrics Explained
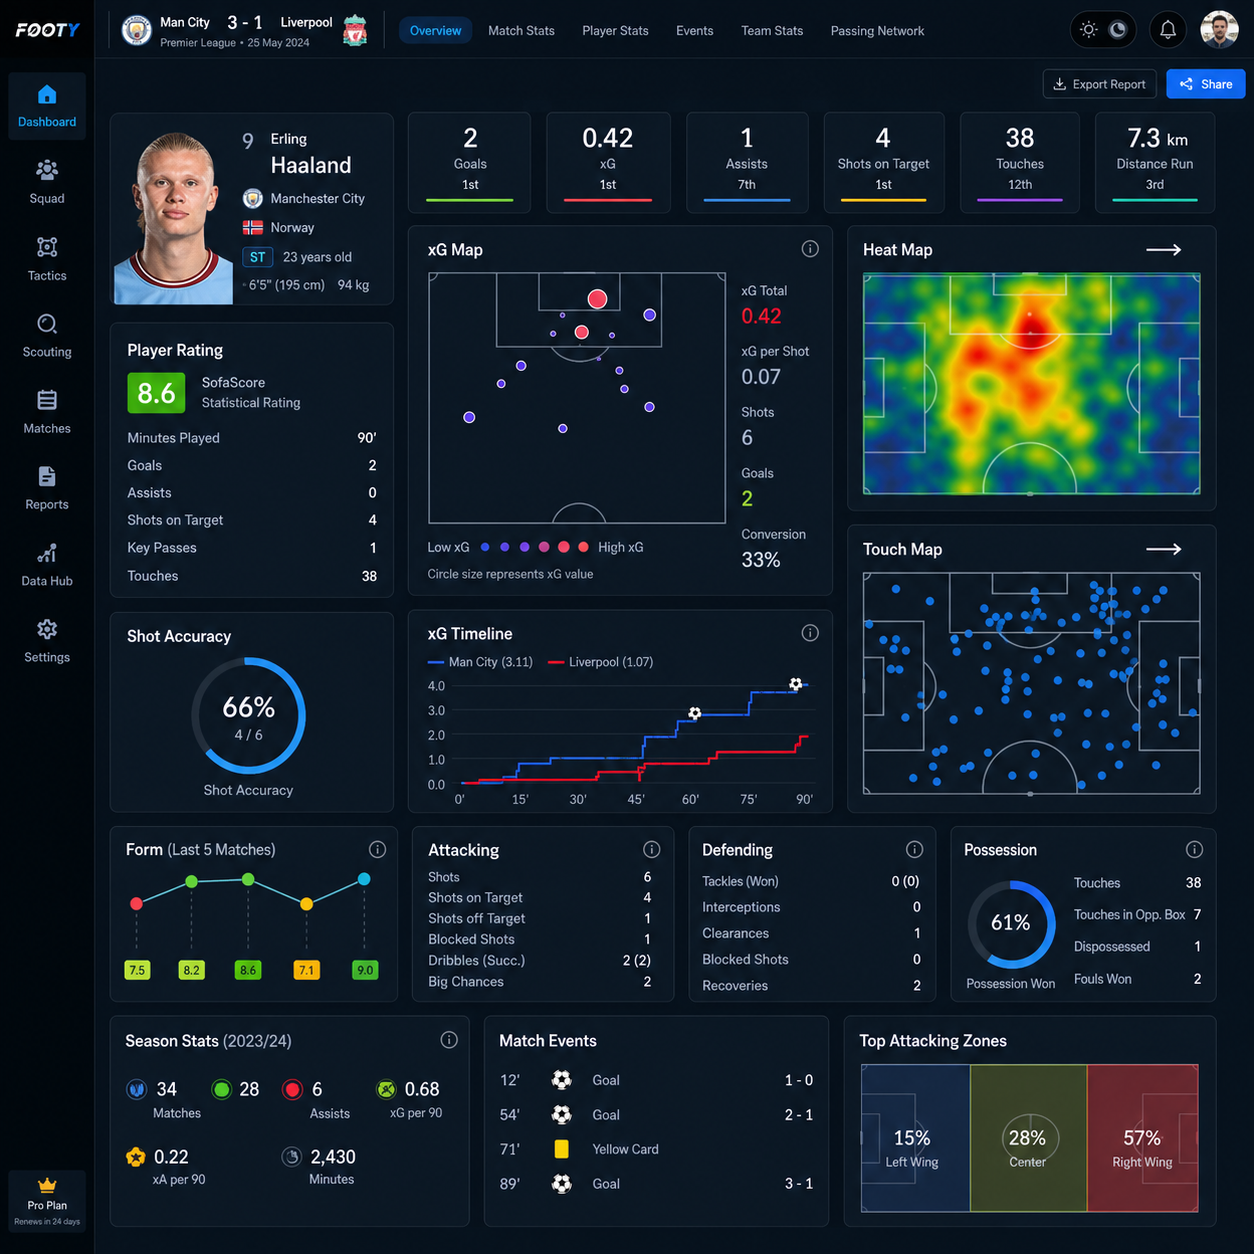
Why Player Statistics Matter in Modern Football
Football statistics have moved far beyond the back page of a newspaper. Data analysis now shapes how clubs recruit players, how coaches build tactics, and how fans understand what they're watching across the Premier League, La Liga, Bundesliga, Serie A, and beyond.
For a long time, the conversation about player quality was driven almost entirely by eye test and reputation. A striker who scored 20 goals was considered elite; a midfielder who didn't appear on the scoresheet was often undervalued. That framing missed enormous amounts of what actually happens during 90 minutes of football.
Today, accessible data platforms have made it possible for anyone — not just professional scouts — to look beyond the scoreline and evaluate player contributions with much more precision. Whether you follow one league obsessively or track players across multiple competitions, understanding statistics gives you a sharper lens.
The Basics — Goals and Assists as Starting Points
Goals and assists are the most recognizable football statistics, and they remain genuinely useful — but they work best as a starting point, not a conclusion.
A goal measures the outcome of an attacking sequence. An assist records the final pass before that goal. Together, these two figures form what analysts call goal contributions — a simple combined count of direct attacking output. For strikers especially, goal tallies carry real weight. Scoring consistently requires composure, positioning, and technique under pressure.
The problem is that both metrics depend heavily on factors outside a player's control. A winger who creates five clear chances in a match but receives no assists because teammates miss the target looks statistically invisible. A striker who taps in three rebounds from close range looks like a star. Neither picture is complete.
Assists also exclude the pass before the assist — sometimes called the "pre-assist" — which can be equally decisive. A midfielder who splits a defense with a 40-yard through ball gets no credit if the receiving player's layoff leads to the goal. These gaps in basic stats are exactly why advanced metrics developed.
Understanding Expected Goals (xG) and Expected Assists (xA)
Expected Goals (xG) measures the probability that a shot will result in a goal, based on factors like shot location, angle, assist type, and whether the chance was headed or from open play. A penalty carries an xG of roughly 0.76; a shot from 35 yards with tight angle might be 0.02. By adding up all shot values across a match or season, xG gives a clearer picture of how many goals a player should have scored given the quality of chances they received.
This matters because it separates finishing luck from genuine performance. A striker who scores 18 goals from an xG of 12 is either an exceptional finisher or running hot — probably some of both. A striker who scores 10 goals from an xG of 17 may be underperforming, or they may be consistently receiving low-quality service that the raw assist count doesn't reveal.
Expected Assists (xA) works on the same principle but applied to passes. Rather than crediting only the final pass before a goal, xA measures the quality of a pass based on how likely it was to produce a goal-scoring chance. A player who consistently delivers high-xA passes into dangerous areas is creating real value, whether or not their teammates convert.
Together, xG and xA offer a far more honest evaluation of attacking contribution than goals and assists alone. They're now standard across most serious football analysis, from FBref to Opta-powered coverage of top European leagues.

Beyond xG — Key Advanced Metrics to Know
xG and xA are the most widely discussed advanced metrics, but several others reveal important dimensions of player performance that goals and assists completely miss.
Key Passes
A key pass is any pass that directly creates a shot attempt, regardless of whether that attempt becomes a goal or earns an assist. For attacking midfielders and wingers, key passes per 90 minutes is one of the clearest indicators of creative output. A player averaging 3+ key passes per 90 is consistently putting teammates in shooting positions.
Progressive Carries and Progressive Passes
Progressive carries track how often a player advances the ball at least 10 yards toward the opponent's goal. Progressive passes measure passes that move the ball significantly forward into dangerous territory. Both stats identify players who break defensive lines and push teams up the pitch — contributions that rarely show up in goals or assists but are crucial to how attacks develop.
Shot-Creating Actions (SCA)
Shot-creating actions capture the two offensive actions — passes, dribbles, or fouls drawn — that directly precede a shot. It's a broader measure of creative involvement than key passes alone and gives a fuller picture of how often a player is at the center of attacking sequences.
Press Intensity and PPDA
Defensive contribution is harder to quantify, but PPDA (Passes Allowed Per Defensive Action) measures how aggressively a team — and by extension, individual players — presses the opposition. Lower PPDA indicates higher press intensity. For midfielders and forwards evaluated on their defensive work rate, pressing stats reveal effort that never appears on a traditional stats sheet.
How to Compare Players Across Positions
Comparing players fairly requires adjusting for playing time and position — and the standard method for both is per 90 minutes normalization.
"Per 90" simply scales any counting stat to a full 90-minute match. A player who scored 8 goals in 1,200 minutes of play (roughly 13.3 full matches) has a per-90 rate of 0.60 — identical to a player who scored 20 goals in 3,000 minutes. Without this adjustment, players with more appearances almost always look better, which rewards availability over quality.
Position context matters just as much. Comparing a striker and a central midfielder on goal tallies is close to meaningless — their jobs are fundamentally different. A striker should be evaluated on xG, goals per 90, and shot volume. A midfielder is better assessed through progressive passes, key passes, SCA, and pressing stats. A defender might be measured on aerial duels won, interceptions, progressive carries out of defense, and how rarely opponents create high-xG chances when they're on the pitch.
Wingers sit somewhere between all three — they're expected to create (key passes, xA) and contribute directly (goals, xG) while also tracking back. No single metric captures a winger's full value, which is why combining four or five complementary stats produces a much more reliable picture than any one number.
Applying Stats Across Different Football Leagues
League context has a significant effect on individual statistics, and ignoring it leads to distorted comparisons between players from different competitions.
The Premier League is widely regarded as one of the most physically demanding and tactically intense leagues in the world. High press intensity and defensive organization mean that chance creation is harder to come by, which tends to suppress xG and key pass numbers relative to, say, the Bundesliga, where teams historically play at higher tempo with more open defensive structures.
La Liga and Serie A have different rhythms again. La Liga has historically rewarded technical midfielders and positional play, while Serie A has often been more defensively structured, making goal-scoring stats harder to accumulate. A striker scoring 15 goals in Serie A may be producing equivalent value to one scoring 20 in a more open league.
Team quality compounds this further. A striker at a dominant club will receive more and better chances than one at a mid-table side — their xG per 90 will likely be higher simply because the team creates more. Evaluating a player in the context of their team's overall expected goals output gives a more accurate read on individual contribution.
Putting It All Together — Building a Complete Player Picture
No single statistic tells the full story of a football player. The goal is to combine multiple metrics into a layered evaluation that accounts for position, league, team role, and playing time.
A practical framework: start with goal contributions (goals + assists) to establish baseline output, then check xG and xA to understand whether that output reflects genuine quality or variance. Layer in key passes and SCA to assess creative involvement beyond direct contributions. Add progressive carries and passes to evaluate ball progression. For midfielders and forwards, check pressing metrics to understand defensive engagement.
What you're building is a profile, not a ranking. Two players can have near-identical xG totals but completely different roles — one might be a penalty-box poacher, the other a deep-lying forward who drops to create. Both profiles can be valuable; they're just valuable in different ways.
The most important habit is resisting the urge to reduce a player to a single number. Statistics are tools for asking better questions, not for delivering final verdicts. Used well, they make watching football richer — and following leagues across Europe considerably more interesting.
Frequently Asked Questions
What is the difference between xG and actual goals scored?
xG represents the probability-weighted value of all shots a player took, based on shot quality. Actual goals are the real outcomes. A player can outscore their xG (exceptional finishing or luck) or fall below it (poor finishing or bad luck). Over a large sample, most players regress toward their xG.
Which stats are most useful for evaluating a midfielder versus a striker?
For strikers, prioritize xG per 90, goals per 90, and shots on target rate. For midfielders, key passes, progressive passes, SCA, and PPDA-related pressing stats are more revealing. Both positions benefit from per-90 normalization to account for playing time differences.
Why do some high-scoring players have low xG numbers?
Some players consistently score from low-probability positions — difficult angles, long range, or tight spaces. This can indicate elite finishing ability, but it can also reflect unsustainable variance. If a player's goals consistently outpace their xG across multiple seasons, finishing quality is the likely explanation.
What does "per 90 minutes" mean and why is it used?
Per 90 normalizes any counting stat to a full match equivalent, making it possible to compare players who have played very different amounts of time. A player with 600 minutes played is scaled to the same baseline as one with 2,700 minutes, which makes quality comparisons far more accurate than raw totals.
How do advanced football stats differ between top leagues like the Premier League and lower divisions?
Top leagues generally feature higher defensive organization, better pressing systems, and more consistent data collection. Lower divisions may have less available data and different pace-of-play dynamics. A player's xG in a lower division doesn't translate directly to expected performance in the Premier League or Champions League — league adjustment is always necessary when comparing across levels.